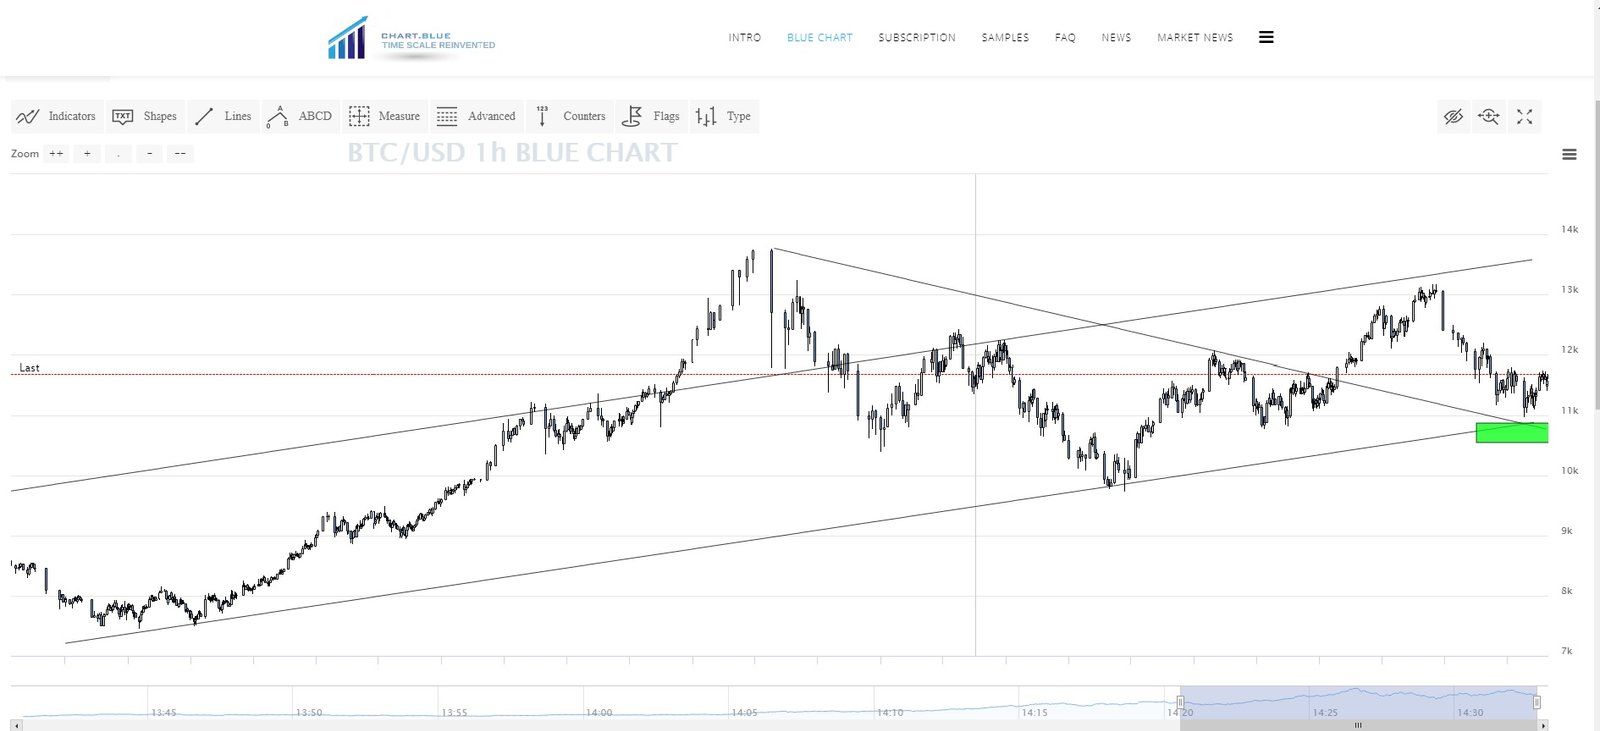
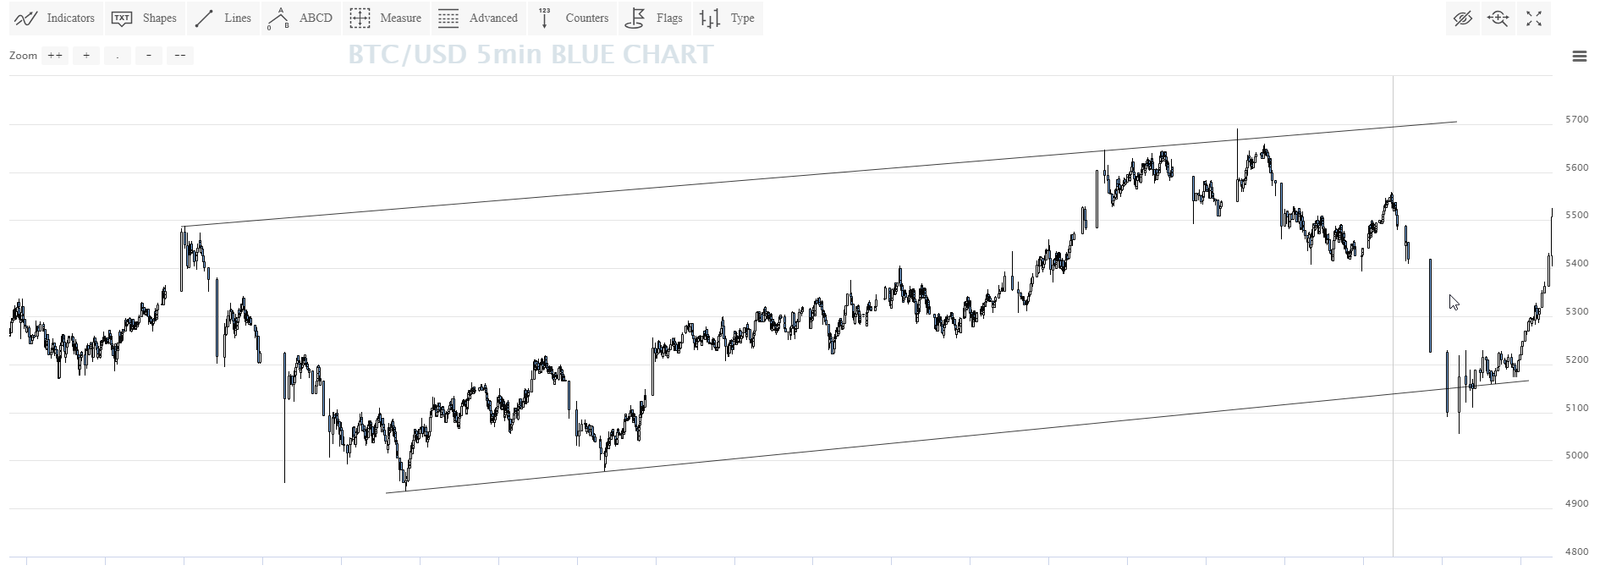
Looks like there is established uptrend channel on our Blue Charts and we bounced of ~11k area recently. It seem that price should move up now towards upper trendline of our bull channel towards ~$13800. Closing below our lower trendline and marked green rectangle area should indicate deeper correction towards ~8k

We can see nice bounce from trend line on Blue charts  on June 7th- and not on regular charts - as usual.

According to 5min BTC/USD blue chart - we are still in the trading channel - on the other hand on regular chart you can see that we broke bottom trend line of the channel already

Here is regular chart

And here is what happen after

You can see the on the Blue Chart trend is reaching to top of trading channel but you can not see that on the regular chart

Page 1 of 2